Population Changes Fueling New Amenities at Major U.S. Gaming Destinations
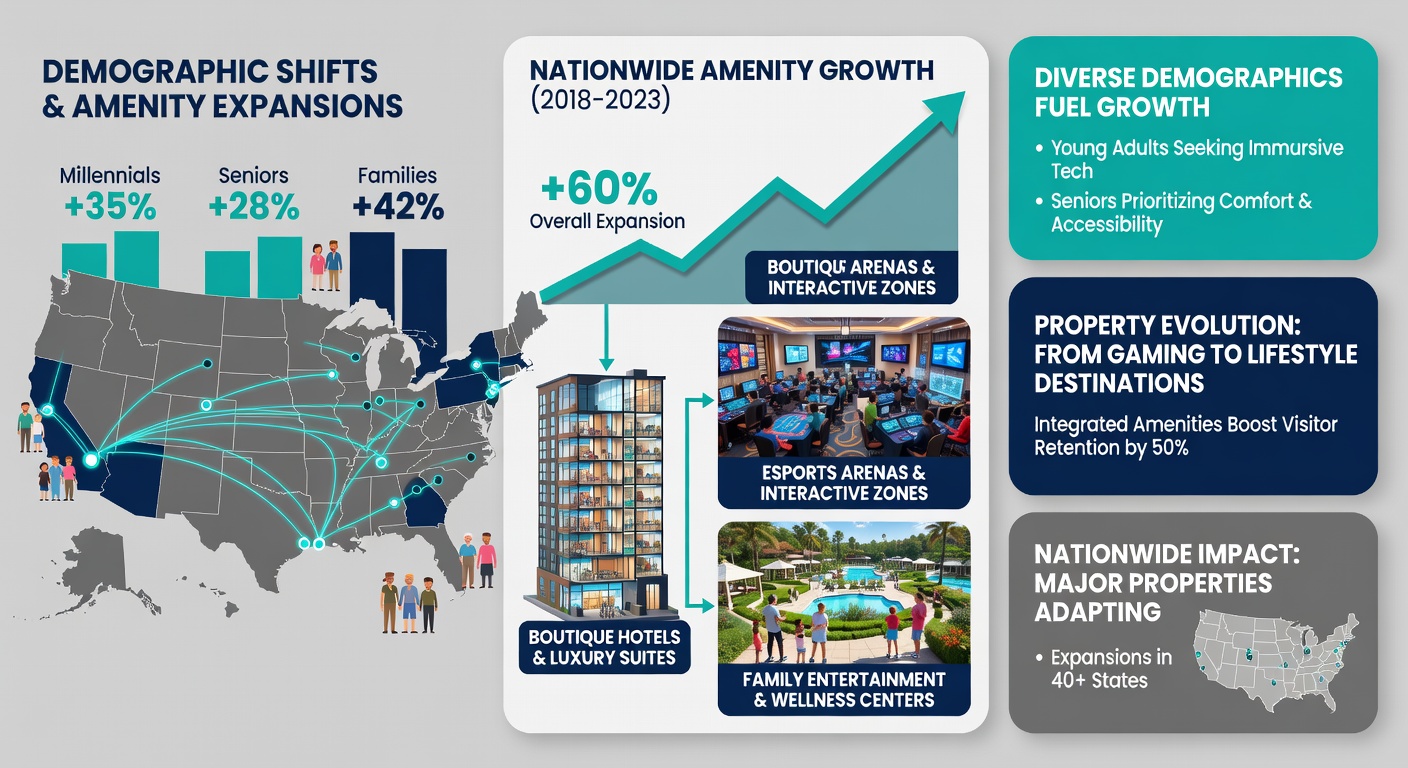
Shifting age groups, rising diversity levels, and evolving lifestyle preferences have prompted operators at large gaming properties to broaden their amenity portfolios in measurable ways, with expansions documented across multiple states through 2026. Census figures reveal that the U.S. population aged 65 and older grew by 22 percent between 2010 and 2020, while younger cohorts aged 25 to 40 now represent a larger share of discretionary spending in hospitality sectors, according to data compiled by the U.S. Census Bureau. These patterns align with observed increases in non-gaming revenue streams at major venues, where wellness facilities, family entertainment zones, and specialized dining concepts have multiplied since 2022.
Key Demographic Drivers Behind the Changes
Researchers tracking visitor profiles note that baby boomers and Generation X visitors continue to favor traditional gaming floors yet increasingly seek integrated health and relaxation options, which has led properties to allocate space for spas, fitness centers, and medical tourism tie-ins. At the same time millennials and Generation Z patrons show stronger interest in experiential and social amenities, prompting additions such as e-sports arenas, rooftop bars, and interactive art installations that extend dwell times beyond slot and table areas. Diversity metrics from recent industry reports indicate growing representation from Hispanic, Asian, and Black visitor segments, each bringing distinct preferences for cuisine, music programming, and cultural events that operators have incorporated into expansion plans.
Data compiled through visitor surveys at properties in Nevada, New Jersey, and Pennsylvania show that roughly 38 percent of new amenity investments since 2023 target multi-generational groups traveling together, while another 27 percent focus on solo or couple experiences centered on wellness and technology integration. These allocations reflect direct responses to household composition trends tracked by federal statistical agencies rather than speculative market moves.
Examples of Amenity Expansions Across Regions
In the Southwest, several large-scale resorts have introduced expanded pool complexes with cabana villages and outdoor fitness circuits designed for older adults seeking low-impact activities alongside younger guests interested in social lounges. Northeast properties have added dedicated family entertainment wings featuring arcade hybrids and educational exhibits that appeal to parents balancing gaming time with child supervision needs. Midwestern venues, including those operated by tribal nations, have prioritized culinary districts highlighting regional and international cuisines to match shifting palate data among repeat visitors.
By May 2026 multiple properties had completed phased openings of these additions, with occupancy and revenue reports indicating sustained utilization across demographic categories. Trade groups such as the American Gaming Association have documented parallel growth in convention and meeting space retrofits that accommodate corporate events drawing mixed-age workforces, further diversifying property income beyond core gaming activities.
Regional Variations and Data Patterns
Observers tracking development permits note distinct regional emphases: coastal markets have leaned toward waterfront promenades and live performance venues while inland locations emphasize indoor water parks and simulation-based attractions. Figures released by state gaming control boards in 2025 showed non-gaming amenities accounting for between 42 and 51 percent of total revenue at the largest properties, up from earlier baselines recorded five years prior. These increases correspond closely with population migration patterns documented in metropolitan statistical areas surrounding gaming hubs.
Academic studies from institutions including the University of Nevada, Las Vegas have examined how household income distribution adn ethnic composition correlate with amenity usage, finding stronger uptake of culinary and entertainment expansions among households earning between $75,000 and $150,000 annually. Such research provides operators with granular insights for prioritizing future capital projects without relying on anecdotal feedback alone.
Looking Ahead to Continued Adaptation
Planning documents filed with local authorities through early 2026 outline additional phases that include technology-enhanced lounges, sustainable design features, and hybrid retail-gaming environments calibrated to emerging visitor cohorts. These steps build on established patterns where demographic data directly informs square footage allocations and service offerings at scale. Industry analysts expect the trend to persist as updated census releases and mobility studies continue to highlight evolving national population structures.
Conclusion
The alignment between measurable population shifts and amenity development at large gaming properties reflects a data-driven approach rather than isolated decisions. Properties nationwide have responded to documented changes in age distribution, household makeup, and cultural diversity by expanding physical and programmatic offerings in targeted categories. Ongoing monitoring by regulatory bodies and research organizations will continue to shape the scope and timing of these investments as demographic profiles evolve through the remainder of the decade.