11 Aug 2026
How Nevada Resort Configurations Shape Betting Decisions and Player Flow

Resort layouts in Nevada incorporate deliberate spatial arrangements that direct player movement through gaming areas, and data from the Nevada Gaming Control Board shows how these designs correlate with specific betting patterns across thousands of daily visitors. Pathways wind past high-denomination machines first, then funnel toward mid-stakes tables, while open sightlines encourage longer stays in designated zones.
Core Elements of Desert Resort Spatial Design
Designers position entrances, elevators, and restrooms to create natural loops that pass multiple gaming stations, and this arrangement increases exposure to slot banks and table games without requiring direct signage. Studies from the University of Nevada, Las Vegas, track how curved corridors slow walking speeds compared with straight hallways, which in turn raises the likelihood of stopping at nearby machines. Lighting gradients shift from brighter public spaces to softer gaming floors, and researchers note that this transition reduces awareness of time passage for many guests.
Resorts cluster restaurants and bars at the far edges of casino sections so that travelers must cross active betting areas to reach them, and traffic counts collected in 2025 confirm higher machine occupancy rates along these routes. In August 2026, several properties plan to adjust these loops based on heat-mapping data that identifies underused corners, while maintaining the same overall flow patterns that have proven effective over multiple seasons.
Measured Effects on Betting Patterns
Placement of progressive jackpot displays near high-traffic intersections correlates with increased play on linked machines, according to figures released by the Nevada Gaming Control Board. Players who enter through main lobby doors encounter these displays within the first thirty seconds, and subsequent session logs show elevated average bets on those specific titles compared with machines located deeper inside the floor. Wide aisles around roulette and craps tables allow larger crowds to gather, which data links to extended observation periods before individuals place their own wagers.
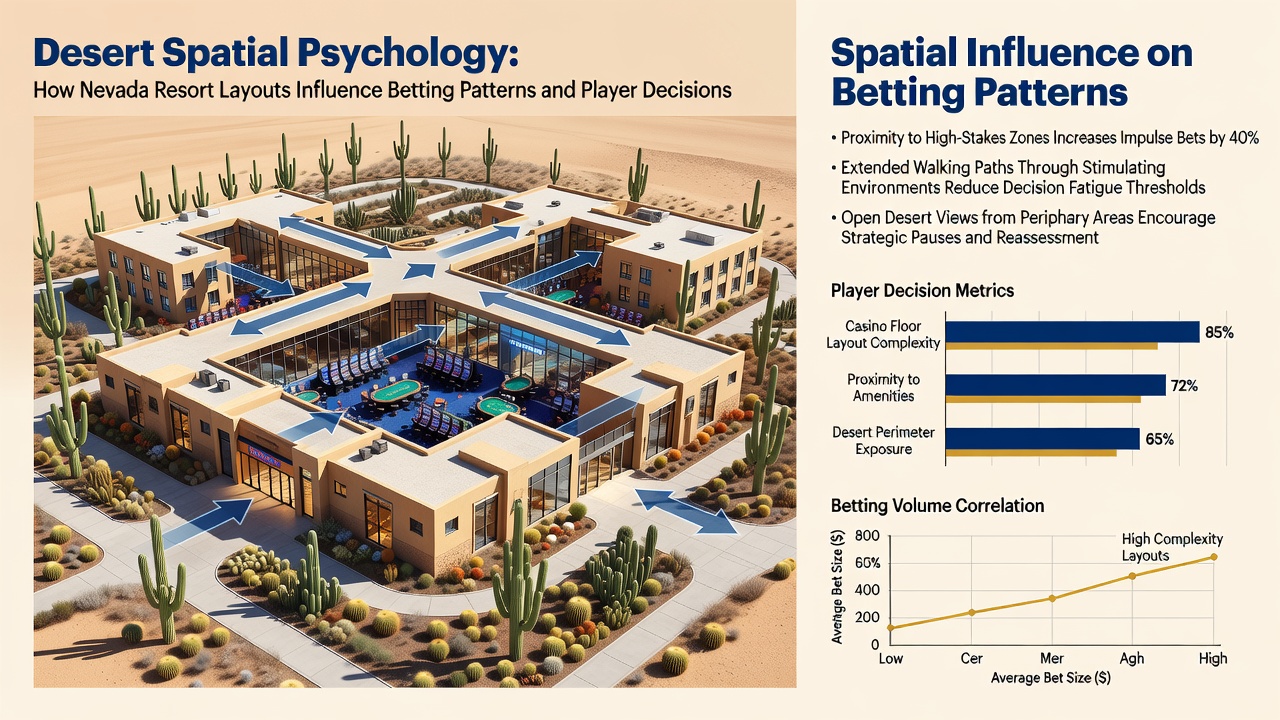
Quiet zones tucked behind banks of video poker terminals draw fewer casual passersby, yet those who reach them tend to remain longer and place smaller, more consistent bets, as recorded in property-level analytics shared with academic partners. Observers note that proximity to restrooms or exits tends to shorten session lengths, while central locations without easy exits extend play times by measurable margins.
Regional Comparisons and Supporting Research
Analyses conducted by Canadian researchers at the University of Waterloo on similar large-scale gaming facilities reveal parallel patterns, where path width and visual anchors influence dwell time and wager size in ways that echo Nevada observations. Australian government reports on venue design further document how external desert landscaping visible through large windows can briefly interrupt immersion, prompting some players to pause or relocate to interior sections with fewer sightlines to the outdoors.
One study released by the International Gaming Institute examined movement data from multiple Nevada properties and found that guests who follow the primary loop place an average of 12 percent more bets per hour than those who cut across secondary routes. These measurements come from anonymized RFID tracking embedded in player cards, which provides precise timestamps without identifying individuals.
Adjustments Observed in Recent Seasons
Properties have introduced movable barriers and temporary seating clusters that alter flow during peak hours, and early results from 2026 indicate modest shifts in table-game occupancy when these elements redirect foot traffic away from crowded aisles. Slot machine density remains highest along the longest sightlines, while lower-density areas near service corridors receive fewer spontaneous visits.
Regulatory filings show that floor-plan changes require approval from the Nevada Gaming Control Board, which reviews proposed layouts for compliance with accessibility standards while also tracking their potential effects on player distribution. These reviews incorporate traffic simulations that predict how new configurations might redistribute betting volume across different game types.
Conclusion
Nevada resort configurations continue to evolve through iterative use of movement data and regulatory oversight, and the documented relationships between spatial elements and betting patterns provide measurable insights for ongoing design refinements. Continued collection of traffic and wager statistics supports further examination of these dynamics across different properties and visitor demographics.