21 Aug 2026
Classifying Gambling Activities and Their Effect on Support Service Distribution
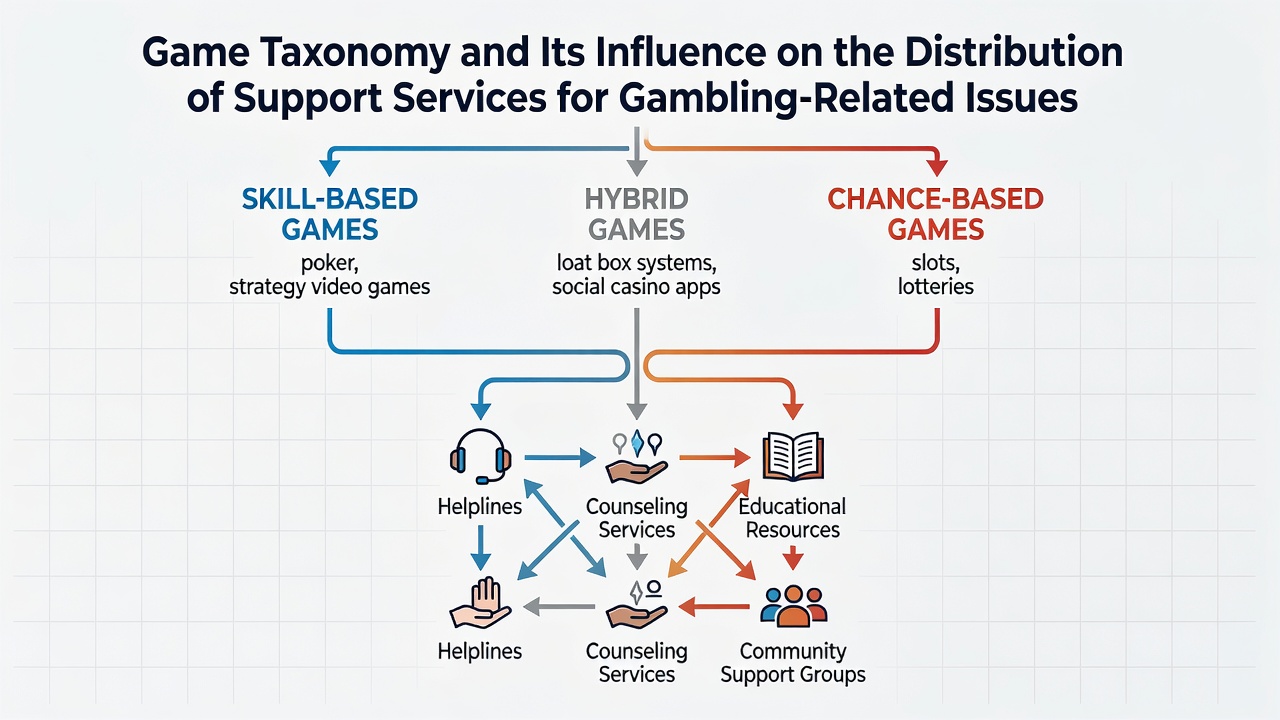
Game taxonomy breaks gambling products into distinct groups based on mechanics, speed of play, and player engagement patterns, and this classification system directly shapes how support services get allocated across regions and populations. Researchers have documented that slots and electronic gaming machines cluster at one end of teh spectrum with rapid cycles and high event frequency, whereas table games and sports betting sit at another end with slower pacing and different decision points, and these distinctions guide where funding and outreach programs concentrate their efforts.
Defining Game Categories Through Structural Features
Taxonomy frameworks organize gambling into segments such as chance-based machines, skill-influenced table games, lottery products, and event-based betting, and classification relies on measurable attributes including payout intervals, stake sizes, and near-miss frequency. Studies conducted by academic teams in multiple countries show that these attributes correlate with varying levels of player involvement and time spent, which in turn informs the design of targeted interventions.
Electronic gaming machines typically feature continuous play loops and variable reinforcement schedules, while poker and blackjack introduce elements of strategy and player choice that alter session duration. Sports betting platforms add live updating odds and in-play options that extend engagement across events, and observers note that each category produces distinct usage data tracked by operators and regulators alike.
Links Between Categories and Problem Gambling Patterns
Data collected through population surveys and clinical intake records indicate that machine-based games associate more frequently with rapid escalation of issues, whereas sports betting correlates with patterns tied to event schedules and social contexts. According to reports from the National Institute on Drug Abuse, individuals reporting problems with electronic gaming machines often seek help earlier in their trajectory compared with those engaged in slower-paced activities, and this timing difference affects how counseling centers prioritize intake procedures.
Canadian Centre on Substance Use and Addiction analyses reveal that category-specific risk profiles help allocate helpline resources during peak periods, and figures from their 2025 monitoring show increased calls related to machine play during certain months. Service providers use these profiles to train staff on common triggers and to develop materials that address the unique features of each game type.
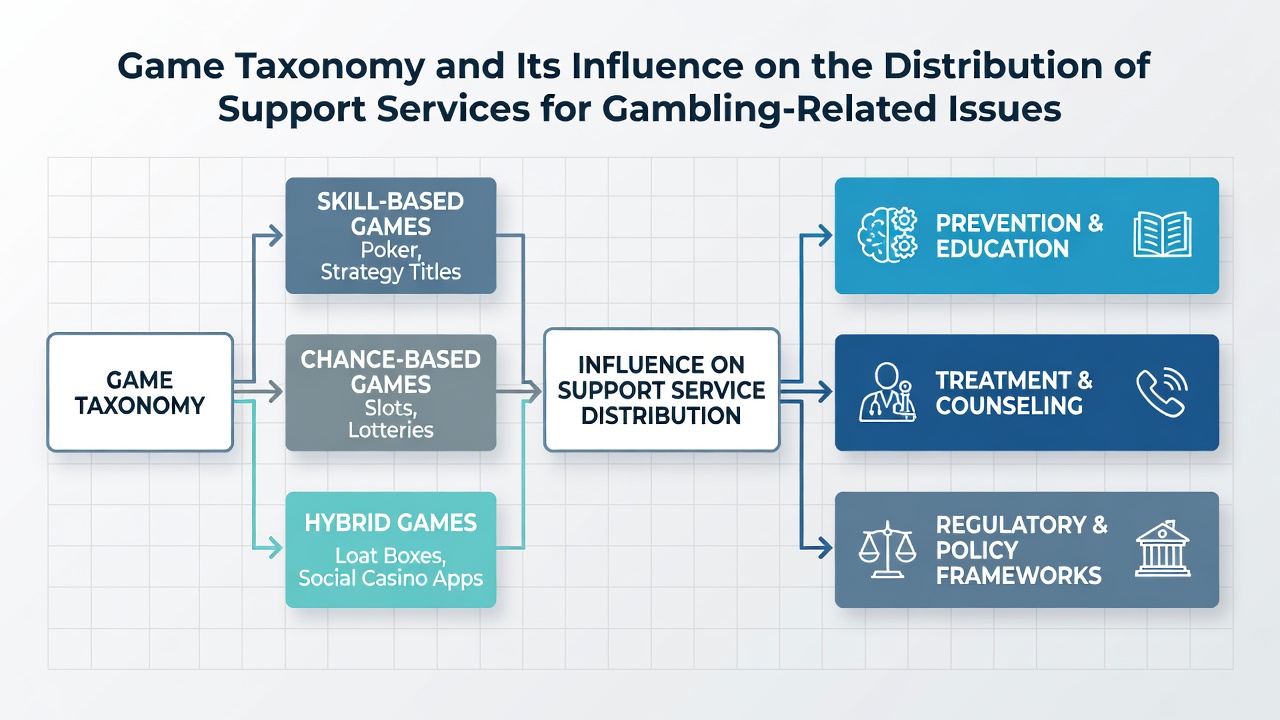
Allocation of Support Services Across Regions
Regulatory bodies and public health agencies adjust funding streams based on prevalence data broken down by game category, and this approach leads to higher concentrations of self-exclusion programs near venues dominated by electronic machines in some jurisdictions. In Australia, state-level health departments direct a portion of machine revenue levies toward treatment centers equipped to handle high-frequency play behaviors, while European monitoring groups track betting exchange activity to forecast demand for online counseling.
Service distribution also follows demographic patterns tied to category preferences, with younger adults showing higher participation in mobile sports betting and older cohorts more commonly engaging with venue-based machines. Programs therefore schedule outreach events and digital campaigns to match these usage clusters, and intake forms now routinely collect game-type details to route individuals toward appropriate modules within cognitive behavioral frameworks.
Policy Developments and Data Use Through August 2026
By August 2026 several jurisdictions had updated their reporting requirements to include granular category data from operators, allowing health agencies to refine resource maps in real time. This shift enables quicker redirection of mobile support units toward areas reporting spikes in machine-related calls and supports the creation of category-tailored online tools that simulate decision points found in table games or betting markets.
Research teams continue to publish comparative studies that test whether interventions matched to taxonomy reduce relapse rates, and early findings suggest modest improvements when materials address the specific reinforcement schedules of each game segment. Government statistical releases now regularly publish cross-tabulated figures that link category prevalence with treatment entry rates, providing clearer signals for budget decisions.
Conclusion
Taxonomy systems supply the structural lens through which support services identify priority areas and calibrate delivery methods, and continued refinement of these classifications supports more precise matching between game features and intervention types. Ongoing data collection across multiple countries supplies the evidence base that keeps allocation decisions aligned with observed patterns in each gambling segment.